Industrial facilities generate enormous volumes of machine data every second. Most of it goes unread, unused, and ignored until something breaks. That is the exact problem an Industrial IoT dashboard solves.
This guide breaks down everything you need to know: how these dashboards work, what they are built on, where they deliver real value on the factory floor, and what the future looks like for plants moving toward Industry 4.0.
What Is an Industrial IoT Dashboard?
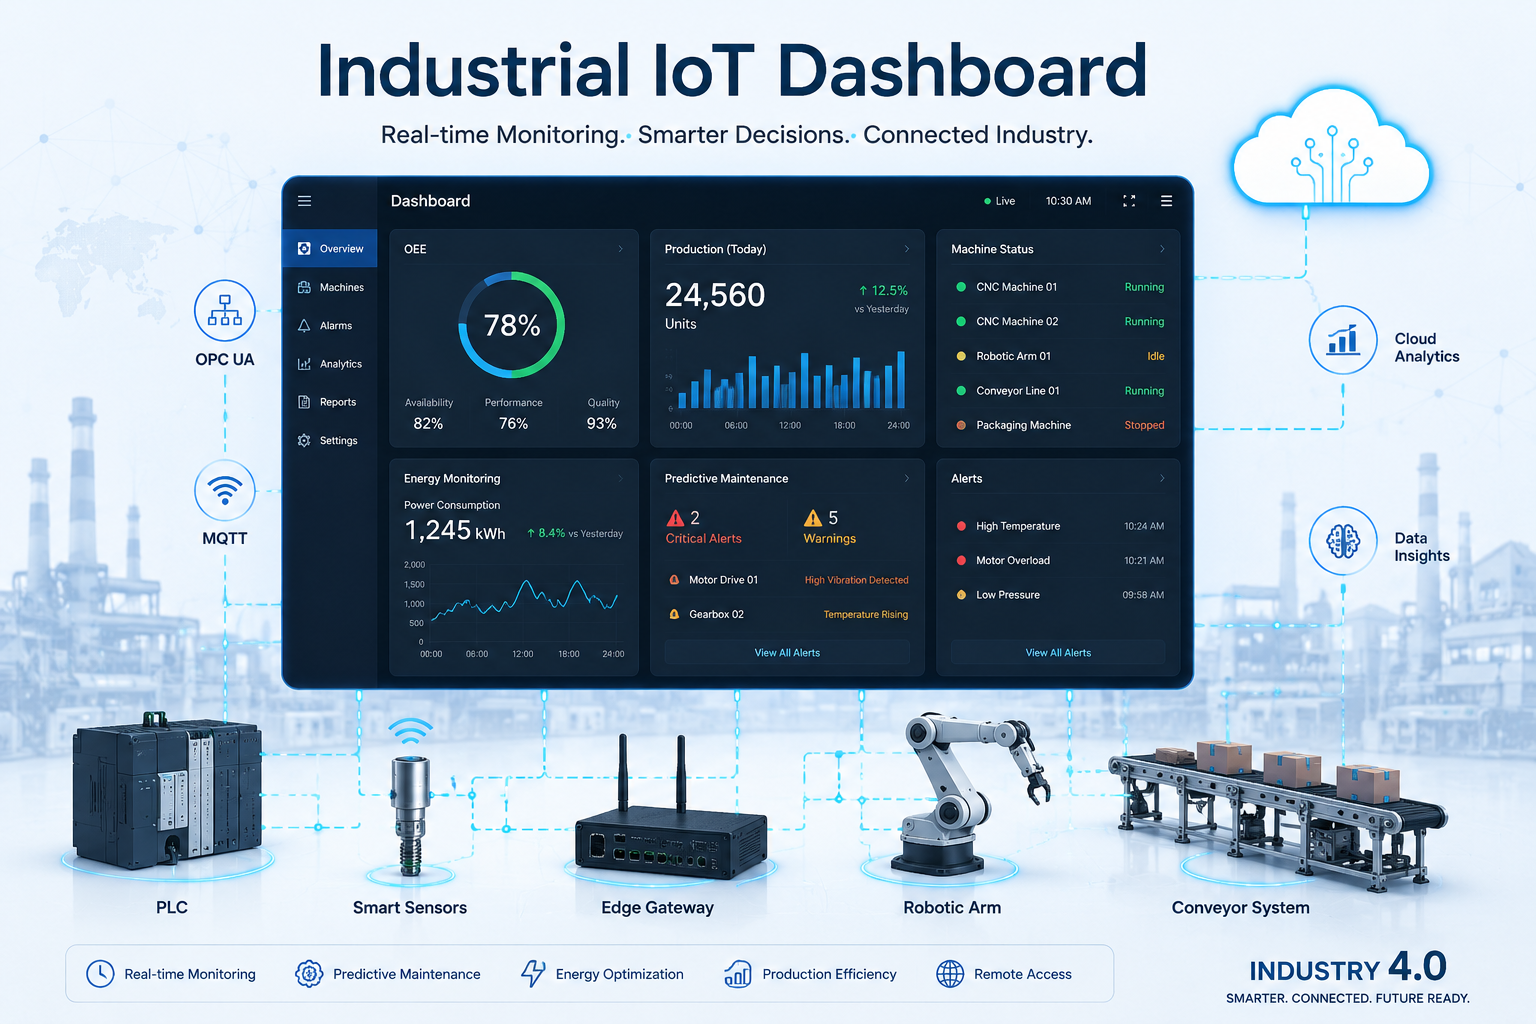
An Industrial IoT dashboard is a centralized visual interface that pulls live data from machines, sensors, PLCs, and industrial systems, then presents it in one unified screen. It gives plant operators, engineers, and managers a real-time view of what is happening across the entire facility.
Think of it as the nerve center of a smart factory. Instead of walking the floor or waiting for a shift report, your team sees machine health, production counts, alarm states, and energy consumption all at once.
Unlike older SCADA screens built for static display, modern IIoT dashboards are built for decision-making. They pull from multiple data sources, apply analytics, and surface insights that trigger immediate action.
Common Data Sources Connected to IIoT Dashboards:
- PLCs (Programmable Logic Controllers)
- SCADA systems
- HMI terminals
- Industrial sensors (temperature, pressure, vibration, flow)
- Industrial gateways and edge devices
- MES and ERP software
- Cloud platforms (AWS, Azure, GCP)
How Does an Industrial IoT Dashboard Actually Work?
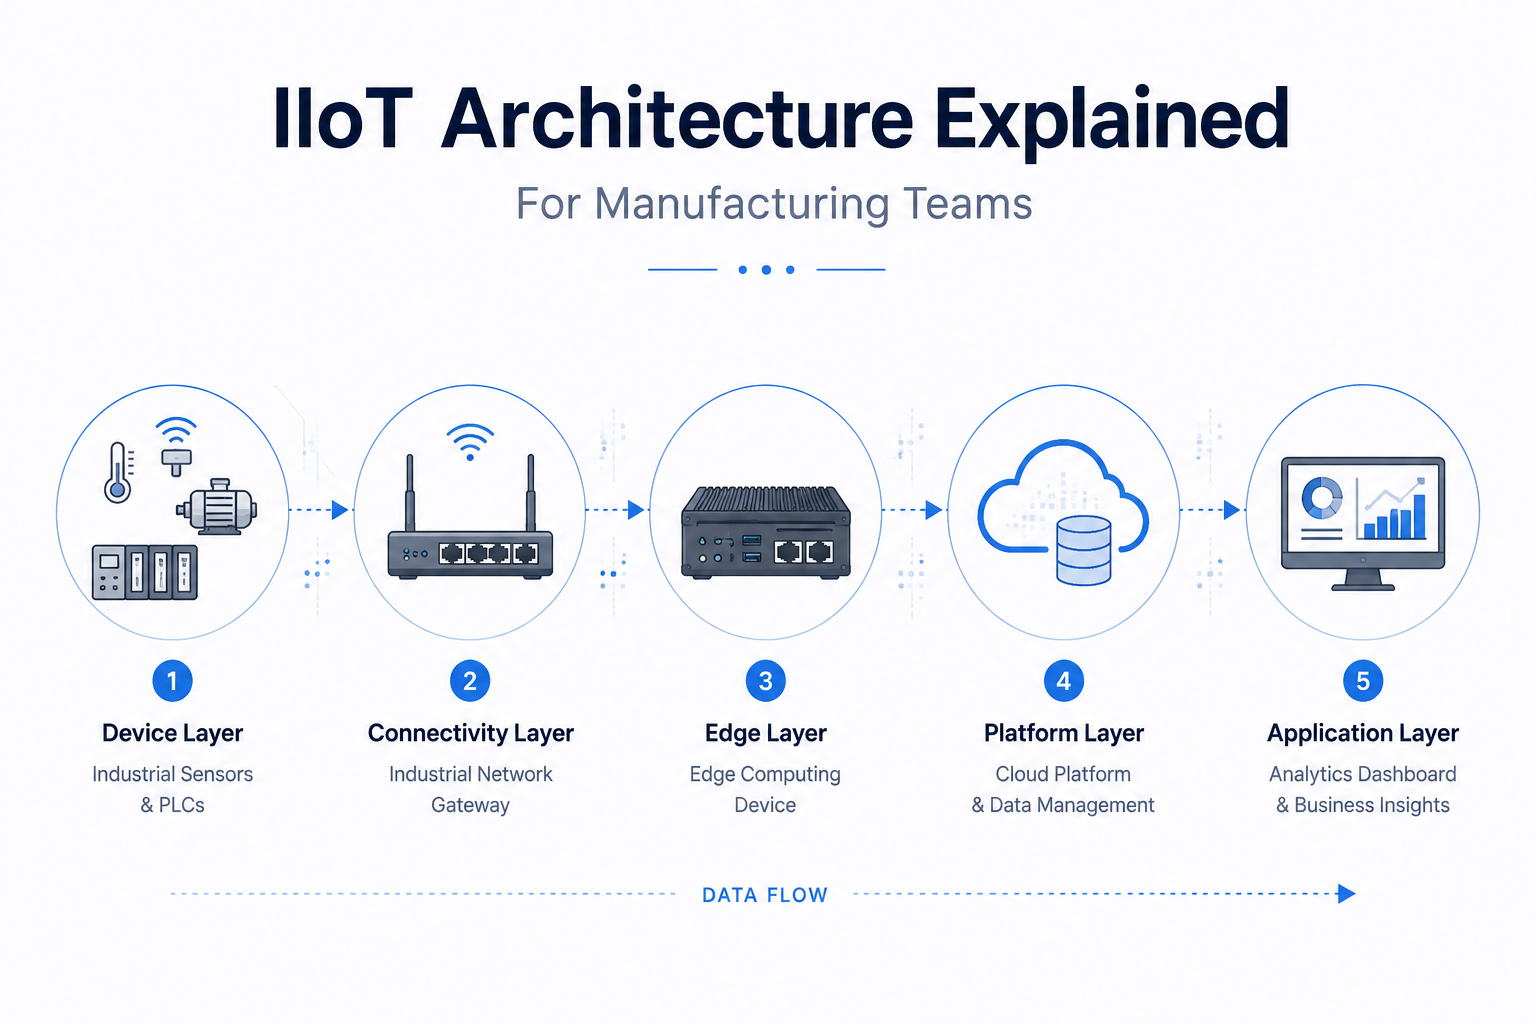
Data travels from the machine to your screen through four distinct layers. Each layer has a specific function, and together they form the operational backbone of the dashboard.
The Data Collection Layer
At the machine level, sensors capture raw physical signals. Temperature probes, vibration sensors, current transducers, and pressure gauges generate continuous data streams. PLCs process those signals locally and make them available for upstream systems.
Edge devices sit close to the machines and aggregate this data before it travels further up the stack.
The Communication Layer
Industrial data does not travel over standard web protocols. It moves through purpose-built industrial communication standards:
| Protocol | Primary Use Case |
|---|---|
| Modbus | Legacy PLCs, sensors |
| OPC UA | Modern machine-to-machine communication |
| MQTT | Lightweight IoT messaging |
| Profinet | Siemens automation environments |
| EtherNet/IP | Rockwell and Allen-Bradley ecosystems |
Choosing the right protocol matters. A mismatch between the machine and the gateway causes data gaps, latency spikes, and unreliable dashboards.
The Data Processing Layer
Once data arrives at the edge or cloud, it gets filtered, aggregated, and contextualized. This is where raw sensor readings turn into actionable metrics.
Edge computing handles time-sensitive processing locally without sending every data point to the cloud. Cloud analytics handles historical storage, trend modeling, and AI-based pattern recognition.
The Visualization Layer
This is the layer users interact with. Dashboards display live machine status, OEE scores, production counts, alarm conditions, downtime breakdowns, and energy usage, all updated in real time.
Core Components You Will Find Inside an Industrial IoT Dashboard
Not all dashboards are structured the same, but the most production-ready ones share a common set of building blocks.
Real-Time Monitoring Panels
These panels show the present state of each machine. Running or stopped. Fault or healthy. Current sensor values. Operators see this layer first and use it to triage issues as they emerge.
Industrial Trend Charts
Line graphs, bar charts, and time-series plots visualize how variables behave over time. Temperature drift, pressure fluctuations, motor current draw, and production throughput all benefit from trend visualization. Abnormalities become visible before they escalate.
Alarm Management System
A well-structured alarm system separates critical faults from informational notifications. Priority tiering prevents alarm floods. Predictive alerts based on threshold breaches give maintenance teams a window to act before failure.
KPI Widgets
Key performance indicators get surfaced here. The most tracked ones in manufacturing environments include:
- OEE (Overall Equipment Effectiveness)
- Unplanned Downtime
- Throughput Rate
- Reject and Scrap Rate
- Energy Consumption per Unit
Historical Analytics Module
Production history, maintenance logs, and performance comparisons over weeks or months live in this section. Engineers use historical data to validate process changes, identify chronic failure patterns, and plan capital investments.
User Access Management
Role-based access controls ensure operators see what they need, engineers get deeper data access, and management gets high-level KPI summaries. Remote login capabilities extend this access beyond the plant floor.
Industrial IoT Dashboard Architecture Explained
The architecture of an IIoT dashboard follows a layered model that mirrors how industrial data flows from the machine to the end user.
Field Layer
This is where the physical world begins. Sensors, actuators, motors, drives, and PLCs generate raw data continuously. The field layer is noisy, diverse, and protocol-heavy. Getting clean data out of this layer is often the hardest part of any IIoT implementation.
Edge Layer
Industrial gateways, edge computers, and protocol converters sit between machines and the network. They normalize data formats, buffer readings during network interruptions, and handle time-sensitive logic locally. Edge computing reduces bandwidth requirements and keeps latency-sensitive operations reliable.
Network Layer
Ethernet remains the backbone of most plant networks. Wi-Fi, private 5G, and VPN tunnels extend connectivity to remote assets and off-site operations. Network reliability directly impacts dashboard responsiveness.
Cloud or On-Premise Server Layer
Data lands here for long-term storage, complex analytics, and dashboard serving. Some facilities run fully on-premise for compliance or security reasons. Others use hybrid architectures that keep sensitive data local while pushing aggregated metrics to the cloud.
Visualization Layer
This is the user-facing layer. Web-based dashboards, mobile interfaces, and large-format control room displays all consume data from the server layer and render it for human consumption.
Types of Industrial IoT Dashboards
Different operational goals call for different dashboard configurations. Here are the main types deployed across manufacturing environments.
Production Monitoring Dashboard
Tracks production rate against targets, shift performance, changeover time, and downtime events. Used by production supervisors and plant managers to keep output on plan.
Energy Monitoring Dashboard
Tracks kilowatt-hour consumption per machine, per line, or per facility. Surfaces compressed air leaks, idle energy waste, and abnormal utility consumption. Used by energy managers and sustainability teams.
Predictive Maintenance Dashboard
Aggregates vibration readings, bearing temperatures, motor current signatures, and lubrication cycles. Uses threshold-based and AI-driven models to flag machines approaching failure before they actually stop.
Quality Monitoring Dashboard
Tracks defect rates, process consistency metrics, and quality KPIs tied to specific production runs. Helps quality engineers identify which machines or shifts are generating out-of-spec product.
Supply Chain and Inventory Dashboard
Monitors raw material levels, work-in-progress inventory, and finished goods movement. Bridges production operations with warehouse and logistics visibility.
Key Features of a Modern Industrial IoT Dashboard
Real-Time Data Visualization
Live factory visibility is the foundational value proposition. Every machine state, sensor reading, and KPI updates on a configurable refresh cycle, typically sub-second for critical parameters.
Remote Monitoring Capabilities
Engineers and managers access the dashboard from mobile devices, laptops, or remote control rooms. This shrinks response time for off-hours incidents and supports multi-site oversight without travel.
Predictive Analytics
AI-based fault detection models analyze historical patterns and live data together to forecast failures days or weeks before they occur. Maintenance scheduling becomes proactive rather than reactive.
Multi-Site Monitoring
A single dashboard instance can aggregate data from multiple facilities. Corporate-level users see aggregate performance. Site-level users see granular machine data. The same platform serves both without customization overhead.
Alarm Notification System
When thresholds are breached, the dashboard pushes alerts via SMS, email, and mobile push notifications. Escalation logic routes the right alert to the right person based on severity and time of day.
Custom Dashboard Builder
Drag-and-drop widget libraries let operations teams configure their own views without involving software developers. Flexible reporting tools generate shift reports, maintenance summaries, and executive dashboards on schedule.
Benefits of Industrial IoT Dashboards
IIoT dashboards improve factory visibility, cut unplanned downtime, reduce energy waste, and accelerate decision-making at every level of the operation.
Better and Faster Decision-Making
When data is visible in real time, decisions happen on evidence rather than gut feeling. Supervisors spot bottlenecks as they form. Engineers catch process drift before it affects quality. Management adjusts shift plans based on live throughput data.
Reduced Unplanned Downtime
Fault visibility shortens the gap between breakdown and response. When an alarm fires and the dashboard shows the affected machine, its recent trend data, and its maintenance history simultaneously, diagnosis time drops from hours to minutes.
Predictive Maintenance at Scale
Rather than replacing components on fixed schedules, maintenance teams use condition data to intervene only when deterioration is detected. This extends asset life and reduces spare parts consumption.
Measurable Productivity Gains
OEE visibility drives improvement initiatives. When operators and engineers see real-time OEE by machine and shift, they can identify exactly which losses (availability, performance, or quality) need attention first.
Energy Cost Reduction
Dashboards that expose per-machine and per-line energy consumption make waste visible. Facilities that have implemented energy monitoring consistently find 8 to 15 percent reduction opportunities in the first year of visibility.
Centralized Oversight Across All Systems
One interface replaces the fragmented view of multiple disconnected systems. SCADA screens, standalone sensor displays, Excel shift logs, and maintenance ticketing systems all feed into a single pane of glass.
Industrial IoT Dashboard vs SCADA System
Both systems have a place in modern manufacturing. Understanding the distinction helps facilities avoid replacing the wrong tool.
| Feature | IIoT Dashboard | SCADA System |
|---|---|---|
| Primary Purpose | Analytics and visibility | Process control and supervision |
| Remote Access | Natively strong | Limited by design |
| Cloud Integration | Native capability | Partial and often vendor-dependent |
| AI and Predictive Analytics | Advanced | Basic or absent |
| Mobile Access | Straightforward | Complex and restricted |
| Historical Analytics | Deep and flexible | Moderate |
| Scalability | High | Medium |
| Legacy Protocol Support | Depends on gateway | Typically strong |
When Factories Use Both Together
The most effective architecture pairs SCADA for real-time control with an IIoT dashboard layered on top for analytics. SCADA manages the process. The IIoT dashboard extracts intelligence from that process data and delivers it in a format that drives operational decisions.
This hybrid approach avoids replacing working SCADA infrastructure while adding modern analytics capabilities on top of it.
Real Industrial Use Cases by Sector
Smart Manufacturing Plants
Discrete manufacturers use IIoT dashboards to monitor OEE across every line simultaneously. When one line drops below target, the dashboard surfaces the specific machine causing availability loss, along with fault codes and duration history. Shift supervisors act in real time rather than discovering the problem at shift handover.
Automotive Assembly Plants
Robotic assembly lines generate enormous volumes of torque, cycle time, and fault data. Dashboards aggregate this across hundreds of stations and flag statistical outliers. Quality engineers use this data to detect process drift at individual stations before defective parts reach the next stage.
Food and Beverage Processing
Temperature, humidity, and sanitation compliance monitoring are non-negotiable in food production. IIoT dashboards track cold chain integrity, CIP cycle completion, and hygiene compliance in real time, with automatic alerts when parameters drift outside safe ranges.
Oil and Gas Operations
Remote pipeline monitoring dashboards track pressure, flow rates, and leak detection signals across distributed assets. Operators in central control rooms manage field equipment without site visits, reducing both cost and safety exposure.
Water Treatment Facilities
Pump station dashboards monitor motor health, flow rates, chemical dosing levels, and basin levels. Predictive alerts on pump bearing wear prevent the kind of unplanned failures that can disrupt water supply to municipalities.
Pharmaceutical Manufacturing
Compliance dashboards track every batch parameter against regulatory specifications in real time. Deviation alerts trigger immediate review workflows. Audit-ready historical records are generated automatically, reducing compliance overhead significantly.
Best Industrial IoT Dashboard Platforms
| Platform | Strengths | Weaknesses | Best For |
|---|---|---|---|
| Siemens Insights Hub | Deep OT integration, strong Siemens ecosystem | Complex to deploy outside Siemens environment | Large Siemens-heavy facilities |
| Ignition SCADA | Flexible, open architecture, strong community | Requires significant configuration | Mid-size manufacturers wanting customization |
| AVEVA Insight | Strong historian integration, cloud-ready | Cost can be high for smaller operations | Process industries, oil and gas |
| PTC ThingWorx | Robust IoT platform, strong connectivity | Steep learning curve | Enterprise-scale IoT programs |
| AWS IoT SiteWise | Scalable cloud infrastructure, strong analytics | Requires cloud dependency | Cloud-first manufacturers |
| Azure IoT Hub | Excellent enterprise integration, AI capabilities | Complex pricing model | Microsoft-ecosystem enterprises |
| Grafana | Open-source, highly flexible, cost-effective | Requires technical setup, not industry-specific out of the box | Data-savvy teams, multi-source visualization |
How to Design an Effective Industrial IoT Dashboard
Keep the Interface Purposefully Sparse
The most common mistake in industrial dashboard design is cramming too many widgets onto one screen. Every panel should answer a specific operational question. If you cannot state the question a widget answers, remove it.
Lead With Actionable KPIs
Surface the metrics that drive decisions first. OEE, active alarms, and downtime are above the fold. Trend data and historical analytics are one click away.
Build a Logical Alarm Hierarchy
Not every fault deserves the same visual weight. Color-coded severity tiers (critical, warning, informational) prevent operators from experiencing alarm fatigue, which is one of the leading causes of missed fault response in high-volume facilities.
Design for the Mobile Engineer
Field engineers respond to alerts from wherever they are. Dashboards that render poorly on a phone or tablet create friction at exactly the wrong moment. Responsive design for mobile access should be a baseline requirement, not an afterthought.
Use Color With Industrial Intent
Red means fault or stop. Green means running. Amber means degraded or warning. These conventions are ingrained in industrial operators. Deviating from them for aesthetic reasons creates confusion and slows response time.
Challenges in Industrial IoT Dashboard Implementation
Data Integration Complexity
Factories run dozens of different machines from different vendors using different protocols and different data models. Normalizing this heterogeneous data into a coherent dashboard requires significant integration work, especially in brownfield environments.
Cybersecurity Exposure
Connecting industrial systems to networks increases attack surface. OT cybersecurity requires network segmentation, encrypted communication channels, role-based access controls, and continuous monitoring. Remote access capabilities demand particular attention.
Legacy Machine Compatibility
Older PLCs were not designed for network connectivity. Getting data out of legacy equipment often requires protocol converters, serial-to-Ethernet adapters, or custom drivers. This adds both cost and complexity to implementation projects.
Network Reliability
Dashboards are only as reliable as the network beneath them. Wireless dead zones, bandwidth contention, and switch failures can cause data gaps that undermine operator trust. Redundant network paths and edge buffering mitigate but do not eliminate this risk.
Data Overload Without Proper Filtering
An IIoT platform that pipes every available data point to the dashboard without contextual filtering creates noise rather than clarity. Effective dashboards display the right data at the right level of abstraction for each user role.
Future Directions in Industrial IoT Dashboards
AI-Powered Prescriptive Analytics
The next step beyond predictive maintenance is prescriptive intelligence, where the dashboard does not just flag a problem but recommends a specific corrective action based on historical outcomes. This closes the loop between detection and resolution.
Digital Twin Integration
Virtual factory models synchronized with live machine data allow engineers to simulate process changes, test maintenance scenarios, and visualize asset health in a three-dimensional representation of the actual facility.
Edge AI Processing
Moving AI inference to the edge layer reduces cloud dependency and enables real-time anomaly detection even during network outages. Edge AI dashboards can operate autonomously and sync with cloud systems when connectivity is restored.
Immersive Visualization Environments
Three-dimensional factory models and augmented reality overlays are beginning to appear in industrial settings. Remote engineers wearing AR headsets can view live machine data overlaid on physical equipment, fundamentally changing how troubleshooting works in complex facilities.
Ending Words
The industrial IoT dashboard is becoming the cognitive center of the modern factory. It is the mechanism through which scattered machine data transforms into operational intelligence that drives measurable outcomes.
The shift toward Industry 4.0 is not primarily a technology story. It is a visibility story. Facilities that can see what is happening across their assets in real time make better decisions, respond faster, and waste less than those operating on lagging indicators and manual reporting.
The right approach is to start with a narrow, high-value use case, prove the return, and scale from there. Production monitoring on a single critical line. Energy tracking in a high-consumption area. Predictive maintenance on your most failure-prone asset class.
Complexity scales naturally once the foundation is solid. What matters most is getting real data onto real screens and into the hands of the people who make real decisions.
FAQs
It is a centralized visual interface that collects real-time data from factory machines, PLCs, sensors, and industrial systems, then displays it as actionable information for operators, engineers, and managers.
SCADA manages and controls industrial processes in real time. An IIoT dashboard layers analytics, remote access, and AI-driven insights on top of that control layer. They serve complementary rather than competing functions.
The most common are OPC UA, MQTT, Modbus, Profinet, and EtherNet/IP. Protocol choice depends on the equipment manufacturer and the age of the installation.
Yes. On-premise and edge-only architectures are fully viable, particularly in facilities with strict data sovereignty or latency requirements. Cloud connectivity adds analytics depth and remote access but is not mandatory.
Manufacturing, automotive, food and beverage, oil and gas, pharmaceuticals, water treatment, energy, and mining are the most active adopters.
Yes. Grafana is widely used in industrial environments, particularly for teams comfortable with open-source tooling. It connects to industrial data sources through plugins and time-series databases like InfluxDB.
Security depends entirely on implementation. Properly configured dashboards with network segmentation, encrypted communications, and role-based access are secure. Poorly implemented ones are not. OT cybersecurity should be a first-class requirement, not a post-deployment concern.
Costs range from a few thousand dollars for a focused single-site implementation using open-source tools to hundreds of thousands for enterprise multi-site platforms with custom integrations and AI analytics. The largest cost driver is typically the data integration layer, not the visualization itself.