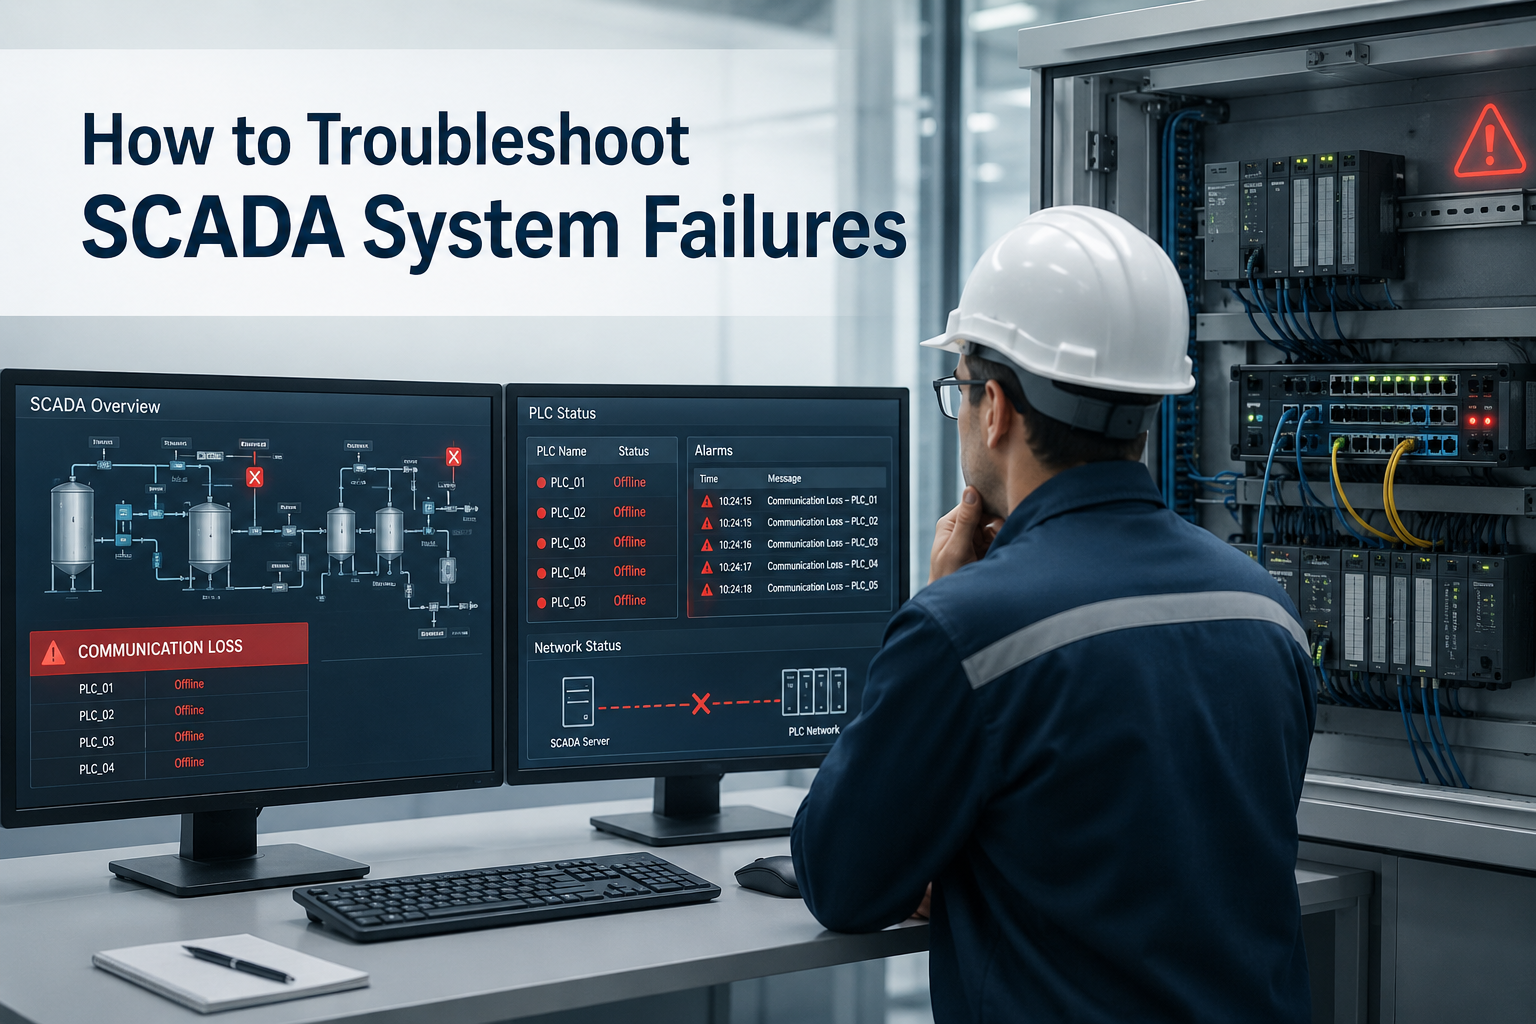
SCADA system failures are caused by communication issues, PLC faults, network problems, hardware failures, software errors, or incorrect configurations. Troubleshooting starts with identifying active alarms, checking communication links, verifying PLC status, inspecting network devices, and reviewing historical logs to find the root cause.
What Is a SCADA System Failure?
A SCADA (Supervisory Control and Data Acquisition) system failure happens when the software, hardware, or communication infrastructure stops performing its intended function. This can range from a full system outage to a partial malfunction affecting specific devices or data streams.
Common symptoms operators report:
- Active communication loss alarms on the HMI
- PLCs showing as offline in the SCADA interface
- Process values freezing or displaying incorrect readings
- Historical data gaps or missing trends
- Slow screen response or frozen HMI displays
Complete failure vs. partial malfunction: A complete failure means the SCADA server is down and all visibility is lost. A partial malfunction means some devices are offline, some tags are bad quality, or specific screens are unresponsive. Knowing which type you are dealing with determines where you start troubleshooting.
Why SCADA System Failures Are Critical in Industrial Automation
Production Downtime
When SCADA goes down, operators lose visibility into the process. Without real-time data, production lines often stop entirely as a safety measure. Even a 30-minute outage can cost thousands of dollars depending on the industry.
Loss of Real-Time Monitoring
SCADA gives operators the ability to monitor temperatures, pressures, flow rates, and equipment status in real time. When the system fails, critical process variables go unmonitored, increasing the risk of equipment damage or product loss.
Data Collection Interruptions
Historians and SQL databases stop recording process data during a failure. This creates gaps in trend data, compliance records, and production reports. In regulated industries like pharmaceuticals and utilities, this can trigger audit issues.
Safety Risks
Many industrial plants rely on SCADA for safety interlocks and alarm monitoring. A failure that prevents operators from seeing alarm states creates direct safety exposure. Some facilities trigger manual shutdowns when SCADA becomes unavailable.
Reduced Equipment Efficiency
Without SCADA oversight, operators cannot optimize process setpoints or respond to equipment performance degradation. Over time, this reduces throughput and increases maintenance costs.
Common Signs of SCADA System Problems
Communication Loss Alarms
This is the most frequent symptom. The SCADA server generates alarms when it cannot reach one or more PLCs. These alarms can appear for a single device or flood the alarm screen for multiple controllers simultaneously.
Offline PLCs
The SCADA interface shows individual PLC nodes as disconnected. This can indicate a network issue, a PLC fault, a power problem, or a configuration mismatch.
Frozen HMI Screens
The screen stops updating. Values appear static even though the process is running. This typically points to a communication timeout, server performance issue, or a crashed SCADA runtime process.
Missing Historical Data
Trend views show gaps. The historian is not receiving or storing tag data. This is often tied to database overload, disk space issues, or a stopped historian service.
Slow Response Times
Screens take longer than normal to load. Alarm acknowledgments are delayed. This suggests high CPU load, memory pressure, network congestion, or excessive tag polling.
Incorrect Process Values
Tags display values that do not match field instruments. This can result from scaling errors, address mismatches, or failed field devices.
Alarm Flooding
Hundreds of alarms appear simultaneously. This usually happens when a network segment fails and every device on that segment goes into communication loss simultaneously.
What Causes SCADA System Failures?
PLC Communication Problems
PLCs communicate with SCADA using Ethernet, serial, or wireless connections. Failures here are among the most common SCADA issues.
Ethernet failures happen when cables are damaged, switch ports fail, or network configuration changes disrupt connectivity. Serial communication issues occur on legacy systems using RS-232 or RS-485 when cables degrade or port settings change. Protocol mismatches arise when firmware updates or configuration changes alter the communication parameters on the PLC side.
Industrial Network Failures
Industrial networks include managed switches, fiber converters, routers, and Ethernet cabling. Any of these components can cause widespread SCADA failures.
Faulty switches can take entire network segments offline. Broken fiber cables disrupt communication between buildings or remote sites. IP conflicts occur when two devices are assigned the same IP address, causing intermittent or complete communication loss.
SCADA Software Errors
The SCADA software itself can fail. Runtime crashes bring down the entire server process. Database corruption prevents the system from reading or writing tag data. Configuration mistakes, such as incorrect tag addresses or wrong protocol settings, cause bad quality readings without producing clear alarms.
Hardware Failures
The SCADA server depends on physical hardware. Server power supply failures, failed hard drives, overheating CPUs, and faulty RAM all cause SCADA outages. On the field side, faulty I/O modules prevent PLCs from reading sensor inputs correctly, causing the SCADA system to display bad data.
OPC Server Issues
OPC servers act as middleware between PLCs and SCADA software. If the OPC server crashes or loses its driver license, all tags stop updating. Tag mapping errors cause specific data points to go bad without affecting others.
Cybersecurity Incidents
Malware attacks, ransomware, and unauthorized access attempts can disable SCADA servers. Overly aggressive firewall rule changes sometimes block legitimate SCADA communication ports, causing sudden communication loss that looks like a network failure.
Step-by-Step SCADA Troubleshooting Process
Step One: Identify the Failure Symptoms
Start by reviewing the active alarm list on the SCADA interface. Document which devices are offline, which alarms are active, and when the failure started.
Talk to the operator. Ask what changed just before the failure. Recent network maintenance, PLC program downloads, or server reboots are common triggers that operators may not immediately connect to the problem.
Determine whether this is a single device failure, a segment failure, or a complete SCADA outage. This narrows the search immediately.
Step Two: Verify PLC Status
Go to the PLC physically or connect remotely using the programming software.
Confirm the PLC is powered on and the CPU status indicator is solid green. A flashing red or solid red CPU light indicates a fault condition. Use the programming software diagnostics screen to read the fault code. Allen-Bradley PLCs display fault codes in RSLogix or Studio 5000. Siemens PLCs report faults in TIA Portal. Mitsubishi PLCs use GX Works3 for diagnostics.
If the PLC is in fault mode, clear the fault and observe whether it returns. Repeat faults indicate a program or hardware issue that requires deeper investigation.
Step Three: Check Communication Between PLC and SCADA
Ethernet Connection
Open a command prompt on the SCADA server and ping the PLC IP address. A successful ping confirms the network path is intact. If the ping fails, the problem is in the network layer, not the SCADA software.
Modbus Communication
If the system uses Modbus TCP or Modbus RTU, verify that the register addresses configured in SCADA match what the PLC is using. A one-register offset is a common configuration mistake that causes bad quality tags.
OPC Server Connectivity
Open the OPC server configuration tool. Check whether the OPC server shows a connected status to each PLC. Review the server event log for driver errors or connection timeouts.
Ping Test and Network Diagnostics
Ping all PLC IP addresses from the SCADA server. Note which devices respond and which do not. Group the non-responding devices to identify whether they share a common switch, VLAN, or network segment.
Step Four: Inspect Industrial Network Components
Go to the network rack or panel and physically inspect each managed switch.
Check the port status LEDs. A port that should be active but shows no link light indicates a cable fault or a failed network device on that port. Log into the switch management interface and review the port statistics. High error counts or CRC errors on a specific port indicate a bad cable or a failing network card.
Inspect fiber converters and media converters. These devices fail silently and are often overlooked. A fiber converter that has lost its receive signal will show no link on the downstream Ethernet port.
Test Ethernet cables using a cable tester if specific devices are not responding despite appearing physically connected.
Step Five: Review SCADA Alarm Logs
The alarm log is one of the most valuable diagnostic tools available.
Look for communication loss alarms and note the exact timestamps. If 30 devices all went into communication loss at the same second, a switch failure or server restart caused it. If devices dropped off one at a time over a period of hours, degrading hardware or a progressive network fault is more likely.
Look for database errors, tag errors, and driver fault messages. These indicate SCADA software or configuration problems rather than network issues.
Step Six: Verify Tag Values
Open the SCADA tag browser or I/O diagnostics screen and review the quality status of each tag.
Bad quality tags indicate the SCADA server cannot read the value from the source device. Good quality tags with incorrect values indicate a scaling or address mismatch. Check the tag configuration and compare the address against the PLC program to confirm they match.
Watch for incorrect scaling. A flow meter reading 10 times its expected value suggests the engineering units scaling in the tag configuration is wrong.
Step Seven: Examine SCADA Server Health
Open Task Manager or a system monitoring tool on the SCADA server.
Check CPU usage. If CPU is consistently above 80 percent, the server is overloaded. This can cause communication timeouts as the SCADA runtime cannot poll all tags fast enough. Check memory consumption. Low available RAM forces the operating system to page to disk, degrading SCADA performance significantly.
Check disk space. If the drive hosting the historian or SCADA database is nearly full, data logging will stop and the SCADA runtime may become unstable.
Review the Windows Event Viewer for application errors, service crashes, or hardware warnings. SCADA runtime crashes often leave detailed error entries in the Application log.
Step Eight: Check Historical Database Performance
Open the historian management console or SQL Server Management Studio.
Verify the historian service is running. A stopped historian service means no data is being recorded even if the SCADA runtime is healthy. Check the database size and available storage. Large databases with poor indexing cause slow queries and can lock up the historian.
Look for database corruption warnings. If the historian reports checksum errors or transaction log issues, a restore from backup may be necessary.
Step Nine: Test HMI and Operator Stations
Open HMI screens one at a time and observe load times.
If specific screens are slow to load, check whether those screens have an unusually high number of tags, large graphic images, or complex animations. These can cause performance bottlenecks that do not affect the overall SCADA server.
Test alarm acknowledgment. If alarms acknowledge slowly, the SCADA server is likely overloaded or the alarm database is experiencing write delays.
Check user permissions. Some SCADA failures are not technical outages. An operator may have lost access to specific screens or functions due to a permissions change.
Step Ten: Restore from Backup if Necessary
If software corruption or database failure is confirmed, a restore from backup is the fastest recovery path.
Restore the SCADA project backup to a known good configuration. Restore the historian database from the most recent clean backup. Roll back the PLC program if a recent download is suspected to have caused the problem.
Always document what was restored and when. After restoration, monitor the system closely for 24 to 48 hours to confirm stability.
How to Troubleshoot PLC and SCADA Communication Failure
Verify IP Address Settings
Log into the PLC and confirm the IP address matches what is configured in the SCADA tag or OPC server. A recent PLC replacement or network change may have introduced an IP mismatch.
Check Ethernet Switches
Confirm the switch port connected to the PLC is active. Review VLAN assignments. A PLC placed on the wrong VLAN will not communicate with the SCADA server even if the physical connection is good.
Test Network Cables
Use a cable tester or swap the cable with a known good one. Industrial environments expose cables to vibration, heat, and moisture that degrade connections over time.
Confirm Communication Protocol Settings
Verify that the protocol configured in SCADA matches the protocol the PLC supports. Ethernet/IP, Modbus TCP, and PROFINET are not interchangeable. Also confirm baud rate and parity settings for serial connections.
Review Firewall Rules
Check whether a firewall between the SCADA server and the PLC is blocking the communication port. Ethernet/IP uses port 44818. Modbus TCP uses port 502. PROFINET uses port 34964. A recent IT security update may have blocked one of these ports.
Examine OPC Server Configuration
Open the OPC server and review each device connection. Confirm the IP address, protocol, and polling rate. Restart the OPC server connection and observe whether it reconnects successfully.
How to Troubleshoot SCADA Alarm Problems
Missing Alarms
Verify that the alarm is enabled in the tag configuration. Confirm the alarm setpoint is within a range that the process would actually reach. Check whether an alarm filter or suppression rule is active.
Repeating Alarms
A repeating alarm usually indicates the process value is oscillating near the alarm setpoint. Add deadband to the alarm configuration to prevent repeated triggering within a narrow range.
False Alarms
Verify the sensor input is accurate. A drifting sensor can trigger alarms that do not reflect real process conditions. Also check scaling to confirm the displayed value matches the actual process value.
Alarm Flooding
Alarm flooding happens when many alarms activate at once. This is usually caused by a network or communication failure that brings multiple devices offline simultaneously. Implement alarm shelving for known communication alarms during maintenance windows. Configure alarm priorities to help operators identify which alarms require immediate attention.
How to Troubleshoot Slow SCADA Performance
Excessive tag count is a common cause. Systems that poll thousands of tags at high frequency put constant load on the server and network. Review the tag list and reduce polling rates for non-critical tags.
High CPU utilization means the server cannot keep up with all active processes. Close unnecessary applications on the SCADA server. Do not use SCADA servers for general-purpose computing tasks.
Database overload occurs when the historian is writing large volumes of data with poor indexing. Archive old data, optimize database indexes, and schedule database maintenance during off-peak hours.
Network congestion reduces communication speed between the SCADA server and field devices. Segment the network to isolate SCADA traffic from general IT traffic.
Historian performance issues often result from excessive data compression settings or too many concurrent client connections. Review historian tuning settings and limit the number of simultaneous trend queries.
SCADA Troubleshooting Tools Used by Engineers
Ping Utility
The most basic and useful tool. Quickly confirms whether a device is reachable on the network.
Wireshark
Captures and analyzes network packets. Useful for diagnosing protocol errors, communication timeouts, and unusual network behavior. Requires familiarity with industrial protocols to interpret results effectively.
OPC Test Client
Connects directly to an OPC server and reads tag values. Isolates whether the problem is in the OPC server, the SCADA software, or the PLC communication.
PLC Diagnostic Software
Studio 5000, TIA Portal, and GX Works3 provide detailed PLC fault codes, I/O status, and communication diagnostics that are not visible from the SCADA interface.
Event Viewer
Windows Event Viewer captures SCADA runtime crashes, service failures, and application errors with timestamps that help correlate failures to specific events.
Network Monitoring Software
Tools like SolarWinds, PRTG, or Nagios provide continuous visibility into network device health, port status, and bandwidth utilization. Alerts on switch port failures before they cause SCADA outages.
Preventive Measures to Avoid SCADA Failures
Regular System Backups
Schedule automated backups of the SCADA project, PLC programs, historian databases, and server configurations. Store backups offsite or on a separate network segment. Test restore procedures periodically.
Network Redundancy
Use managed switches with ring topology or RSTP (Rapid Spanning Tree Protocol) to provide automatic failover when a switch or cable fails. Redundant network paths reduce downtime from single-point network failures.
Predictive Maintenance
Monitor switch port error rates, server temperatures, UPS battery health, and disk health using SNMP or monitoring software. Replace hardware showing early signs of degradation before it causes a failure.
Software Updates
Keep SCADA software, OPC server drivers, and operating systems patched. Vendors regularly release updates that fix communication bugs and stability issues. Always test updates in a staging environment before applying to production.
Industrial Cybersecurity Practices
Segment SCADA networks from corporate IT networks using firewalls. Disable unused network ports and protocols. Use role-based access control on the SCADA server. Monitor for unauthorized access attempts. Train operators to recognize social engineering and phishing attempts targeting industrial systems.
PLC Program Documentation
Maintain current documentation of PLC programs, I/O maps, and tag addresses. Undocumented changes are a leading cause of SCADA configuration mismatches after maintenance activities.
Alarm Management Optimization
Review the alarm system regularly. Remove stale alarms, adjust setpoints that generate frequent nuisance alarms, and implement alarm priorities. ISA-18.2 provides a recognized standard for industrial alarm management.
Best Practices for Faster SCADA Troubleshooting
- Maintain updated network diagrams that show all IP addresses, switch locations, and cable paths
- Use standardized tag naming conventions so engineers can identify tags quickly without referring to documentation
- Document all IP addresses and keep the list current after any network changes
- Monitor server CPU, memory, and disk usage continuously using a monitoring tool
- Schedule quarterly preventive maintenance checks on switches, cables, and SCADA server hardware
- Keep spare switches, cables, and power supplies available on-site to reduce repair time
Real Industrial Example of SCADA Failure Troubleshooting
Problem
A manufacturing plant SCADA system displayed communication loss alarms for 18 PLCs simultaneously. All affected PLCs were on the same production floor.
Root Cause
The managed Ethernet switch connecting the production floor devices to the SCADA server experienced an internal hardware failure. The switch stopped forwarding packets, cutting off all devices connected to it.
Solution
The engineer pinged all 18 PLCs from the SCADA server. All pings failed. Pinging devices on other network segments succeeded. This isolated the fault to the production floor network segment. Physical inspection of the switch confirmed that no port link lights were active despite devices being connected. The switch was replaced with a spare unit. Devices were reconnected, all PLCs came back online, and SCADA communication restored within 15 minutes. Historical data resumed logging normally after reconnection.
When Should You Call a SCADA Expert?
Some failures are beyond the scope of in-house troubleshooting. Contact a qualified SCADA engineer when:
- Communication failures recur frequently and the root cause cannot be identified
- PLCs are going offline repeatedly despite apparent network health
- The SCADA server is crashing and in-house IT cannot stabilize it
- The historian database shows corruption that cannot be repaired locally
- Cybersecurity incidents are suspected involving unauthorized access or malware
- System integration issues arise from adding new devices or upgrading SCADA versions
How AutomatexLab Helps Troubleshoot SCADA System Failures
AutomatexLab provides specialized SCADA troubleshooting services for industrial facilities across manufacturing, utilities, and process industries.
Remote SCADA Troubleshooting
AutomatexLab engineers can connect remotely to diagnose communication failures, review alarm logs, and analyze server performance without requiring an on-site visit. This reduces response time significantly for facilities that cannot afford extended downtime.
PLC Communication Diagnostics
The team diagnoses Ethernet/IP, Modbus TCP, PROFINET, and serial communication failures across Allen-Bradley, Siemens, and Mitsubishi PLC platforms. Communication issues are traced to their source using protocol analyzers and PLC diagnostic tools.
OPC Server Configuration Support
AutomatexLab configures and repairs OPC UA and OPC DA servers, corrects tag mapping errors, and resolves driver conflicts that cause bad quality data in SCADA systems.
Network Troubleshooting
The team inspects industrial network infrastructure, identifies faulty switches and cables, resolves IP conflicts, and recommends redundancy improvements to prevent future failures.
SCADA Migration and Upgrades
For facilities running outdated SCADA software, AutomatexLab manages migration to modern platforms while maintaining production continuity. This includes tag migration, historian data transfer, and HMI screen rebuilds.
Preventive Maintenance Solutions
AutomatexLab develops preventive maintenance programs that include regular system health checks, backup verification, and proactive hardware replacement to reduce unplanned downtime.
FAQs
Recurring communication loss is most commonly caused by network faults such as failing switches or degraded cables, PLC hardware issues, IP address conflicts, or OPC server instability. If the problem recurs after basic fixes, a network analysis using Wireshark or port-level switch monitoring is needed to identify the pattern.
Start by checking whether the PLC is powered on and fault-free. Then ping the PLC IP address from the SCADA server. If the ping fails, the issue is in the network. If the ping succeeds but SCADA still shows communication loss, check the OPC server connection and verify the tag address and protocol settings.
Engineers commonly use Wireshark for network analysis, Ping utilities for connectivity checks, OPC test clients for server diagnostics, PLC programming software for fault code review, and Windows Event Viewer for server error logs. Network monitoring platforms like PRTG or SolarWinds are used for ongoing health visibility.
Yes. If a PLC enters fault mode, loses power, or stops executing its program, the SCADA system loses access to process data for that device. All tags associated with that PLC will show bad quality or communication loss status in the SCADA interface.
The most effective prevention strategy combines regular backups, redundant network infrastructure, continuous server health monitoring, industrial cybersecurity controls, and scheduled preventive maintenance. Keeping PLC and SCADA documentation current also reduces troubleshooting time when failures do occur.